本篇文章使用的是 Prometheus v2.40 源码
转载请声明出处哦~,本篇文章发布于luozhiyun的博客:https://www.luozhiyun.com/archives/725
本篇文章主要是整理一下 Prometheus 的时序数据库是怎么存储以及管理数据的,希望这篇文章能给大家带来一定的启发。
概述
我们先来看看 Prometheus 的整个架构图:
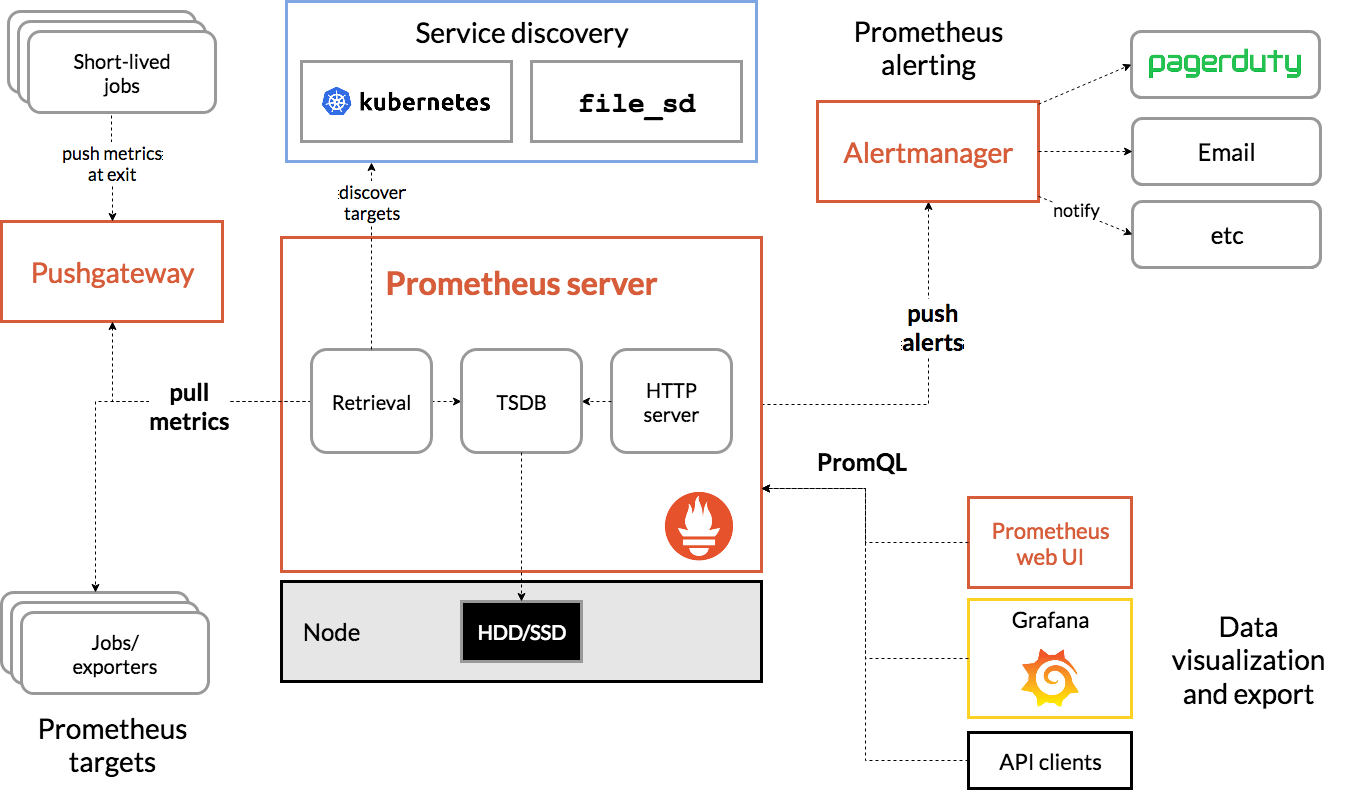
对于 Prometheus Server 来说,整个数据处理流程分为三部分:Exporter 指标的收集、Scraper 数据的抓取、TSDB 数据的存储及查询;Exporter 其实不同的服务有不同的收集实现,类似 Mysqld-exporter、node exporter 等我们这里不做过多的解读,大家基本只需要知道它会暴露一个端口,由 Scraper 定时从它上面采集就好了。Scraper 数据抓取部门我们下面再详细说明。
我们先来认识一下,什么是时序数据库 (Time Series Database, TSDB)。 TSDB 是专门用来存储随时间变化的数据,如股票价格、传感器数据等。时间序列(time-series)的是某个变量随时间变化的所有历史,而样本 (sample)指的是历史中该变量的瞬时值:
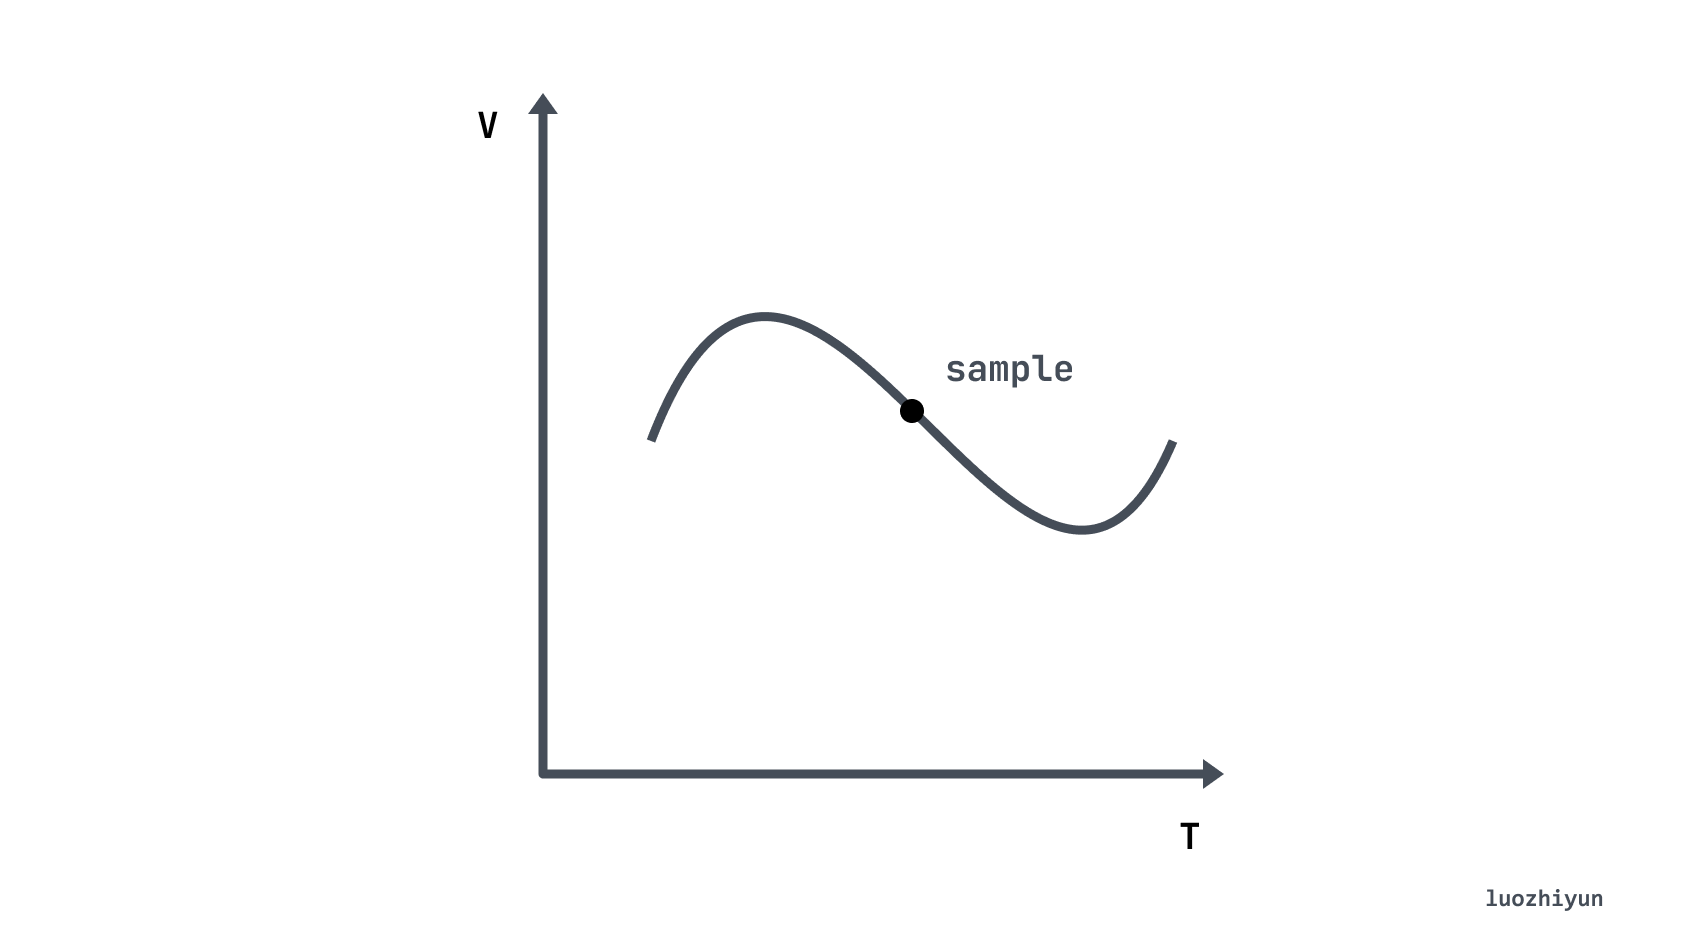
回到我们的主角 Prometheus, 它会将所有采集到的样本(sample)数据以时间序列(time-series)的方式保存在内存数据库中,并且定时保存到硬盘上。时间序列是按照时间戳和值的序列顺序存放的,每条time-series通过指标名称(metrics name)和一组标签集(labelset)命名。如下所示,可以将时间序列理解为一个以时间为Y轴的数字矩阵:
  ^
  │   . . . . . . . . . . . . . . . . .   . .   node_cpu{cpu="cpu0",mode="idle"}
  │     . . . . . . . . . . . . . . . . . . .   node_cpu{cpu="cpu0",mode="system"}
  │     . . . . . . . . . .   . . . . . . . .   node_load1{}
  │     . . . . . . . . . . . . . . . .   . .
  v
    <------------------ 时间 ---------------->
所以根据上面的图,我们可以理解到,每一个点称为一个样本(sample),样本由以下三部分组成:
-
指标(metric name):metric name和描述当前样本特。例如上面的 node_cpu 表示节点的 CPU 信息;
-
时间戳(timestamp):一个精确到毫秒的时间戳,表示数据记录的时间;
-
标签(Lables):使同一个时间序列有了不同维度的识别,例如
node_cpu{cpu="cpu0",mode="idle"}表示所有 cpu0 状态为 idle 的信息,当 mode 等于 system 时则为一个新的 metric; -
样本值(value): 一个 float64 的浮点型数据表示当前样本的值,也就是上图的 Y 轴。
TSDB 数据写入
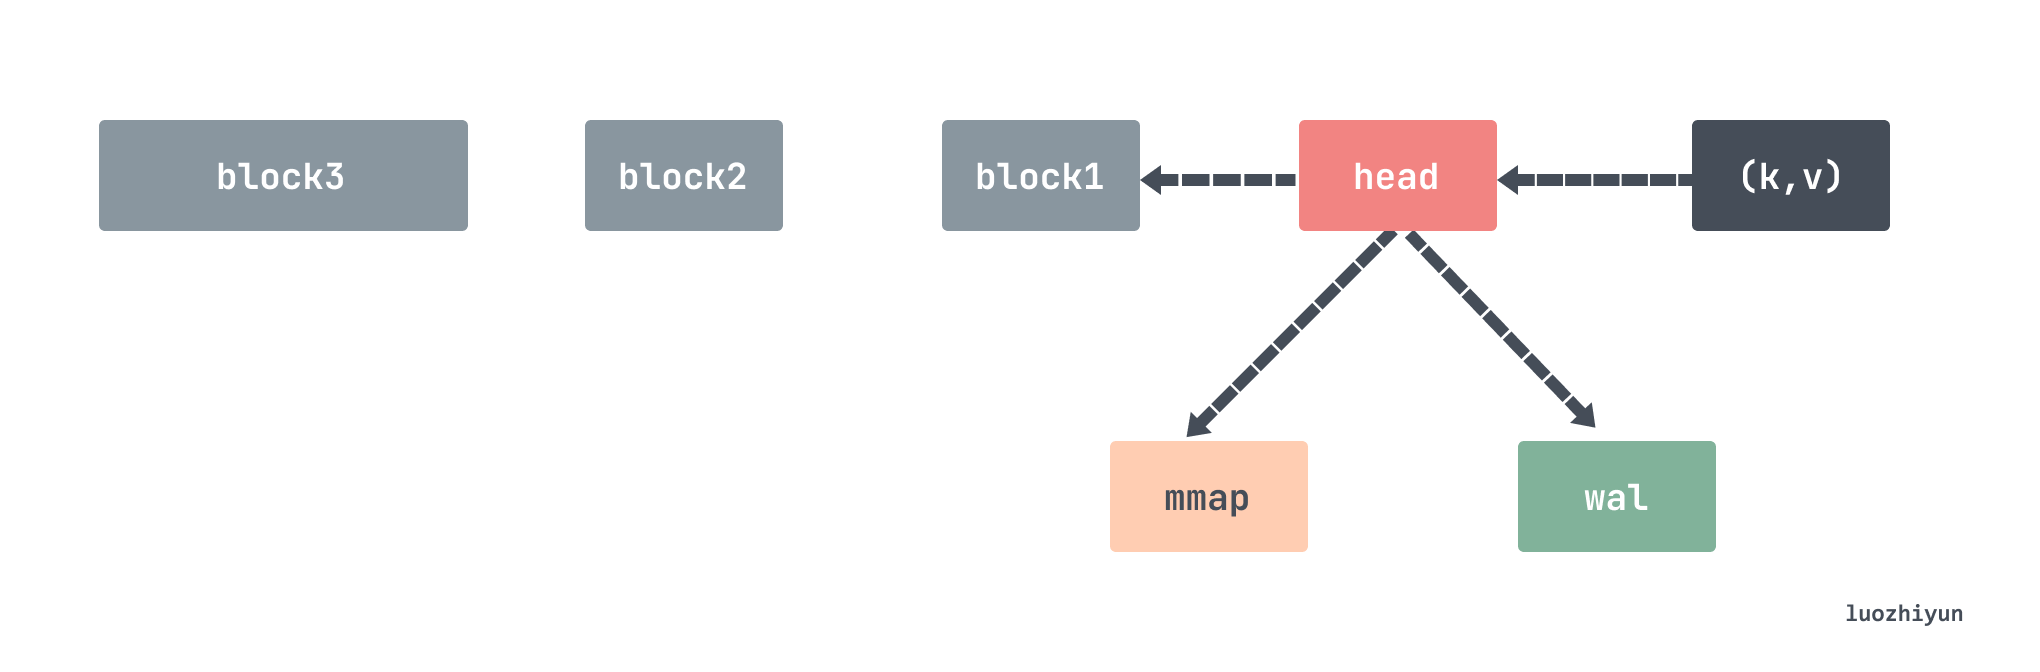
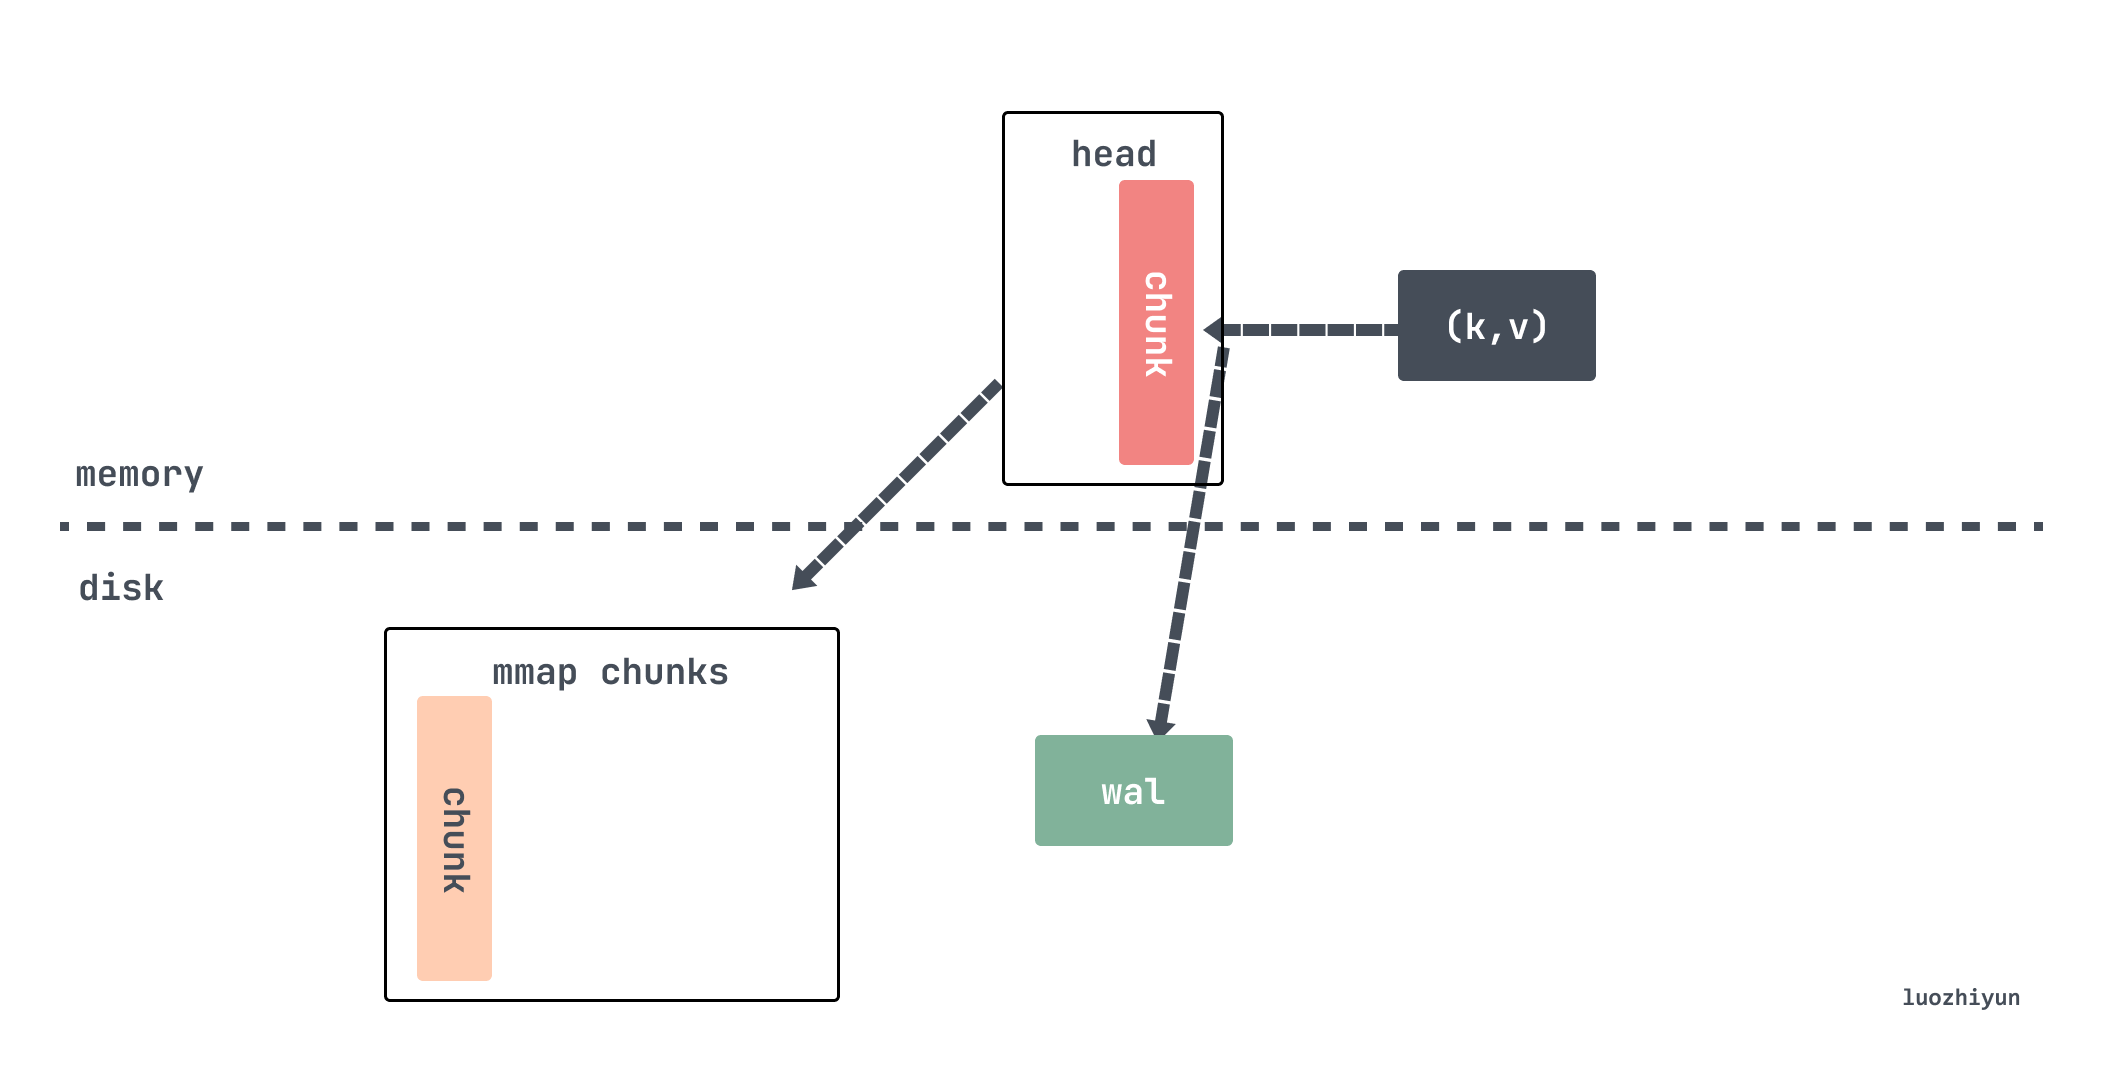
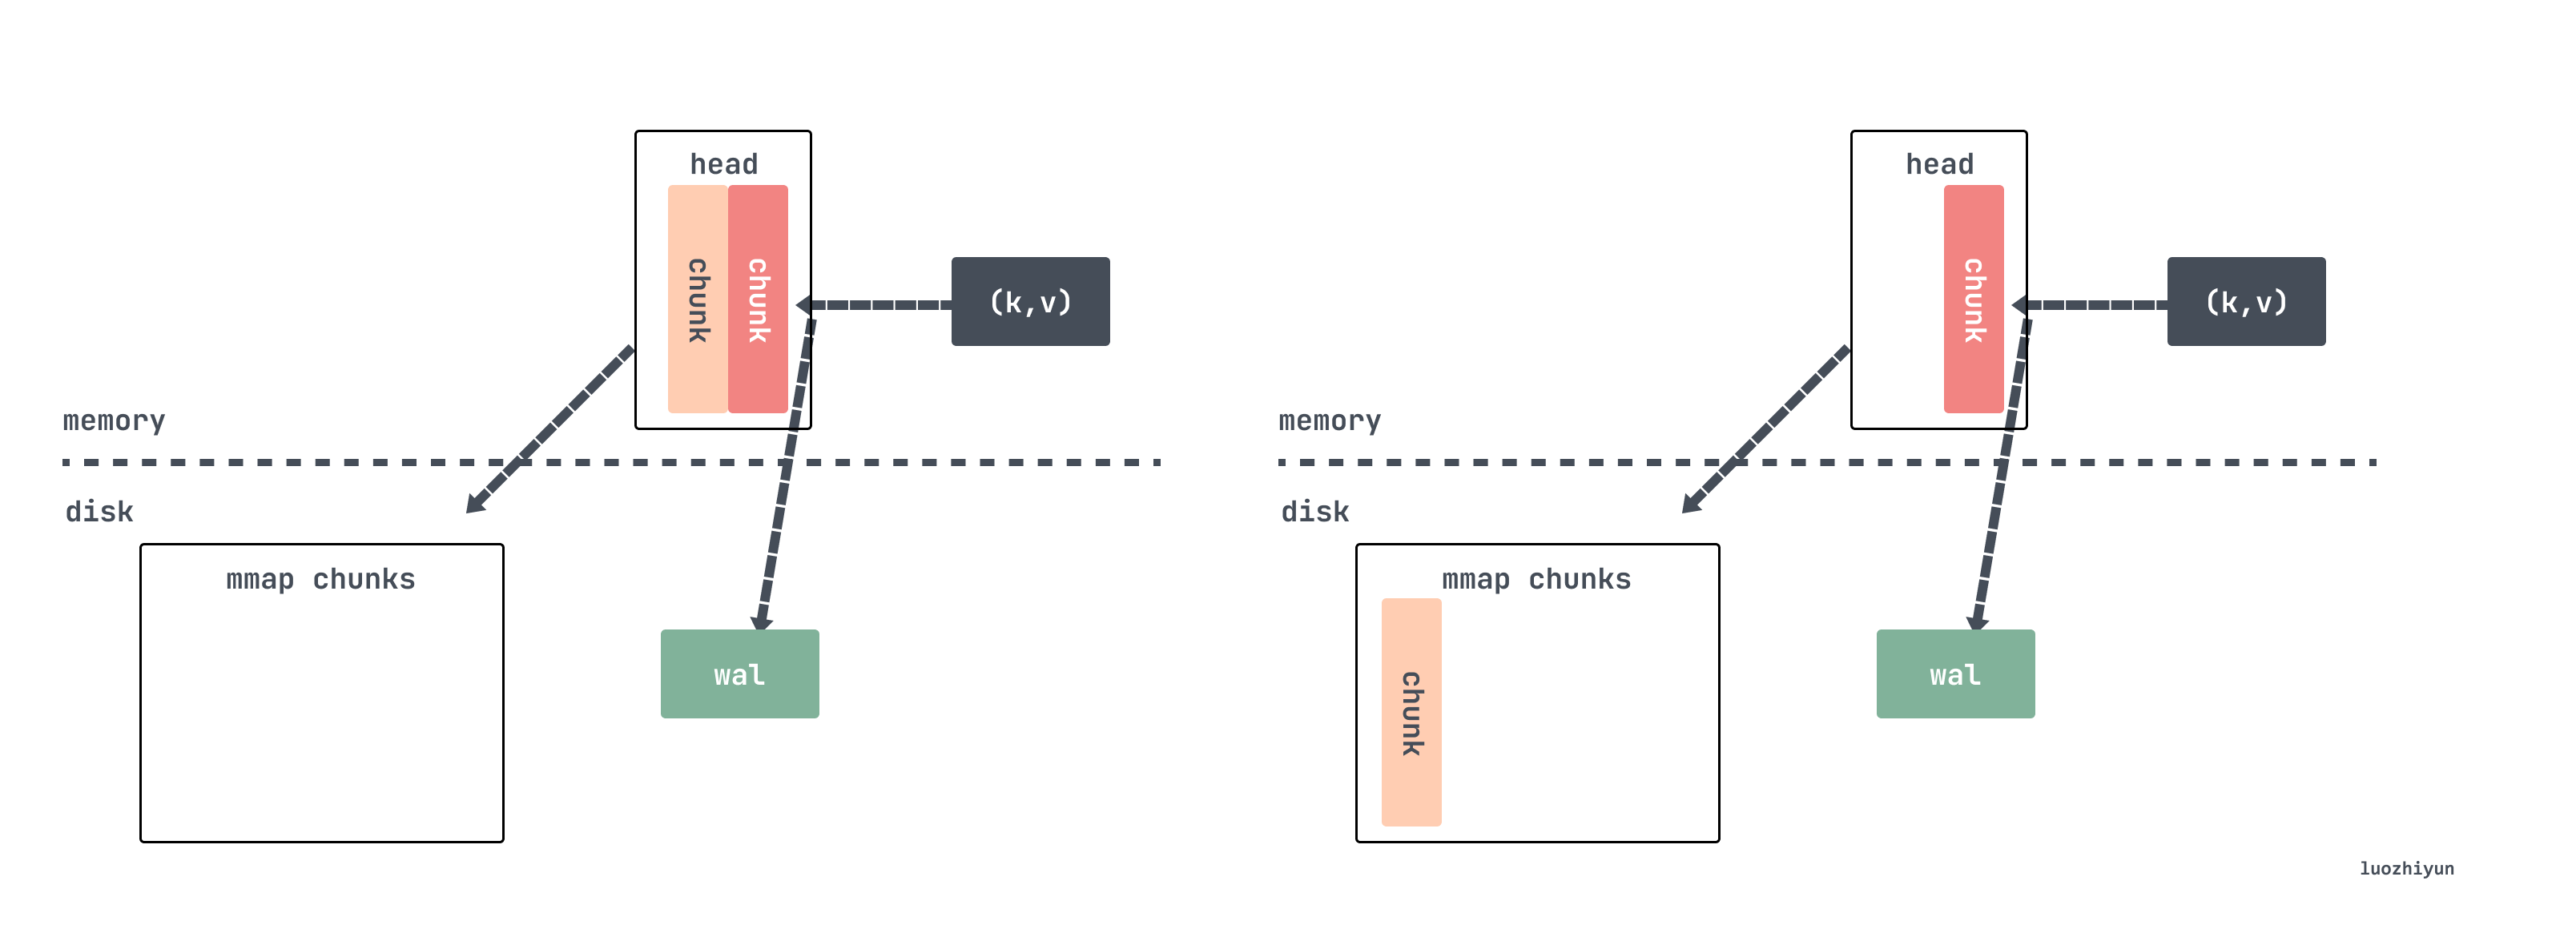
对于 Prometheus 的 TSDB 先是写入到 head 数据块和 WAL(Write-Ahead-Log)预写日志中,head 数据块是位于内存中,WAL 日志是用来做数据的临时持久化用的,防止掉电重启之后仍然能恢复内存中的数据。head 内存中的数据写入一段时间之后会通过 mmap 以数据块 chunk 的形式刷到磁盘中,内存中只保留对 chunk 的引用。当持久化到磁盘的 chunks 数据量达到一定阈值的时候,就会将这批老数据从 chunks 中剥离出来变成 block 数据块。更老的多个小的 block 会定期合成一个大的 block,最后直到 block 保存时间达到阈值被删除。
默认所有数据都会放在 ./data 目录下面,里面存放了 chunks_head、wal、block 三种类型的数据。
./data
├── 01GJ9EKDWSS1TA1V0RBP707V21
│   ├── chunks
│   │   └── 000001
│   ├── index
│   ├── meta.json
│   └── tombstones
├── chunks_head
│   └── 000012
└── wal
    ├── 00000013
    ├── 00000014
    ├── 00000015
    └── checkpoint.00000012
        └── 00000000
每个 block 会存储 2 小时时间窗口内所有 series 指标数据,每个 block 文件名都会使用 github.com/oklog/ulid 这个库生成不重复的文件名,里面包含了 metadata 文件、index 文件、chunks 文件夹,所有指标数据都存放在 chunks 文件夹中,chunks 中包含了多个数据段信息,每个数据段会按照 512MB 分成一个文件存储,被删除的数据会存放在 tombstone 文件夹中。
chunks_head 文件夹里面也包含了多个 chunks ,当内存的 head block 写不下了会将数据存放在这个文件夹下面,并保留对文件的引用。
wal 文件夹里面存放的数据是当前正在写入的数据,里面包含多个数据段文件,一个文件默认最大 128M,Prometheus 会至少保留3个文件,对于高负载的机器会至少保留2小时的数据。wal 文件夹里面的数据是没有压缩过的,所以会比 block 里面的数据略大一些。
head block
v2.19之前,最近 2 小时的指标数据存储在内存中,v2.19 引入 head block,最近的指标数据存储在内存中,当内存存满时将数据刷入到磁盘中,并通过一个引用关联刷到磁盘的数据。
head block 是唯一活跃的 block,除了它以外,其它 blocks 都是不可变的。我们在上面也说了,数据每次从 scraper 抓取过来之后都会存放到 appender 里面,这个 appender 实际上就是 headAppender, 通过调用 Append 方法将数据暂时缓存起来,通过appender来做批量的添加,然后 commit 才会真正写数据。
// tsdb/head_append.go
func (a *headAppender) Append(ref storage.SeriesRef, lset labels.Labels, t int64, v float64) (storage.SeriesRef, error) {
    // 获取该stripeseries对应的memSeries,ref实际上是lset的hash值
    s := a.head.series.getByID(chunks.HeadSeriesRef(ref))
    if s == nil {

        var created bool
        var err error
        // 不存在则创建为该指标创建一个 memSeries
        s, created, err = a.head.getOrCreate(lset.Hash(), lset)
        if err != nil {
            return 0, err
        }
        if created {
            a.series = append(a.series, record.RefSeries{
                Ref:    s.ref,
                Labels: lset,
            })
        }
    }
    ...
    // 将数据缓存起来
    a.samples = append(a.samples, record.RefSample{
        Ref: s.ref,
        T:   t,
        V:   v,
    })
    a.sampleSeries = append(a.sampleSeries, s)
    return storage.SeriesRef(s.ref), nil
}
所有的指标数据都是存放在 stripeseries,每次都需要 lset(相当于是指标的key)获取对应的 memSeries,getByID 里面会根据传入的 lset 维度来加锁,通过分段锁的方式减少锁冲突。memSeries 是真正的数据存放的地方,存放了最近添加的指标对应的(t,v)键值对。所以这里只是设置了 sampleSeries 和 samples 的关联关系,等到下面 Commit 的时候会将相应的数据取出来添加到 memSeries 。
// tsdb/head_append.go
func (a *headAppender) Commit() (err error) {

    // 写入wal日志
    if err := a.log(); err != nil {
        _ = a.Rollback() // Most likely the same error will happen again.
        return errors.Wrap(err, "write to WAL")
    }
    ...
    for i, s := range a.samples {
        series = a.sampleSeries[i]
        series.Lock()
        ...
        // 写入数据
        ok, chunkCreated = series.append(s.T, s.V, a.appendID, a.head.chunkDiskMapper, chunkRange)
        series.Unlock()
    }
    ...
    return nil
}
Commit 方法会将保存在 samples 中的数据拿出来,然后通过调用 memSeries 的 append 将数据循环写入。
// tsdb/head_append.go
func (s *memSeries) append(t int64, v float64, appendID uint64, chunkDiskMapper *chunks.ChunkDiskMapper, chunkRange int64) (sampleInOrder, chunkCreated bool) {
    // 判断head 里面的 chunk 是否已满需要写入到磁盘,创建新的chunk
    c, sampleInOrder, chunkCreated := s.appendPreprocessor(t, chunkenc.EncXOR, chunkDiskMapper, chunkRange)
    // 调用 xorAppender 添加指标数据
    s.app.Append(t, v)
    c.maxTime = t
    ...
    return true, chunkCreated
}
写入的时候会校验当前写入的 chunk 是否已经写满了 120 个 sample ,如果写满了,那么需要将老的数据从 head chunk 中通过 mmap 写入到磁盘中。如果设置的是 15s 的抓取间隔,那么 120 个 sample 的跨度是 30 分钟。
// tsdb/head_append.go
func (s *memSeries) appendPreprocessor(
    t int64, e chunkenc.Encoding, chunkDiskMapper *chunks.ChunkDiskMapper, chunkRange int64,
) (c *memChunk, sampleInOrder, chunkCreated bool) {
    const samplesPerChunk = 120

    c = s.head()

    if c == nil {
        // head chunk 里面还没有chunk ,那么先创建一个
        c = s.cutNewHeadChunk(t, e, chunkDiskMapper, chunkRange)
        chunkCreated = true
    }

    numSamples := c.chunk.NumSamples()
    if numSamples == 0 {
        c.minTime = t
        // chunkRange 默认是2hour,这里算的下次开始的时间是个以2为倍数的整数时间
        s.nextAt = rangeForTimestamp(c.minTime, chunkRange)
    }
    // 到1/4时,重新计算预估nextAt,下一个chunk的时间
    if numSamples == samplesPerChunk/4 {
        s.nextAt = computeChunkEndTime(c.minTime, c.maxTime, s.nextAt)
    }
    // 到达时间,或数据刷的太快,以至于chunk里面数据量已经超过 240个samples,创建新的headChunk
    if t >= s.nextAt || numSamples >= samplesPerChunk*2 {
        c = s.cutNewHeadChunk(t, e, chunkDiskMapper, chunkRange)
        chunkCreated = true
    }

    return c, true, chunkCreated
}
上面这个时间计算很有意思,写入 head chunk 的时候会会校验是否写入数量已达 1/4,如果是的话调用 computeChunkEndTime 函数根据已写入的 1/4 的数据计算平均写入速率,计算出 120 个 sample 会在大约什么时候写完,然后返回时间作为 chunk 的切割时间
这里很没有通过直接判断写入数量是否达到 samplesPerChunk 来切割,而是通过时间,这就有很大的弹性空间。如果数据突然写慢了,chunk 数量不足 120 个 sample 也会进行切割,如果写快了 chunk 里面的 sample 数量会超过 120 个,但不能超过 2 倍的 samplesPerChunk 。
当然,在写 head chunk 的时候还有大小限制, 大小也是 128M 为一个文件写入:
const MaxHeadChunkFileSize = 128 * 1024 * 1024 // 128 MiB.
func (f *chunkPos) shouldCutNewFile(bytesToWrite uint64) bool {
    return f.offset == 0 || // First head chunk file.
        f.offset+bytesToWrite > MaxHeadChunkFileSize // Exceeds the max head chunk file size.
}
如果确定要切割 chunk 的话会调用 cutNewHeadChunk 方法将老的数据通过 mmap 的方式写入到磁盘,然后给 memSeries 创建新的 head chunk,只保留对旧数据的引用。
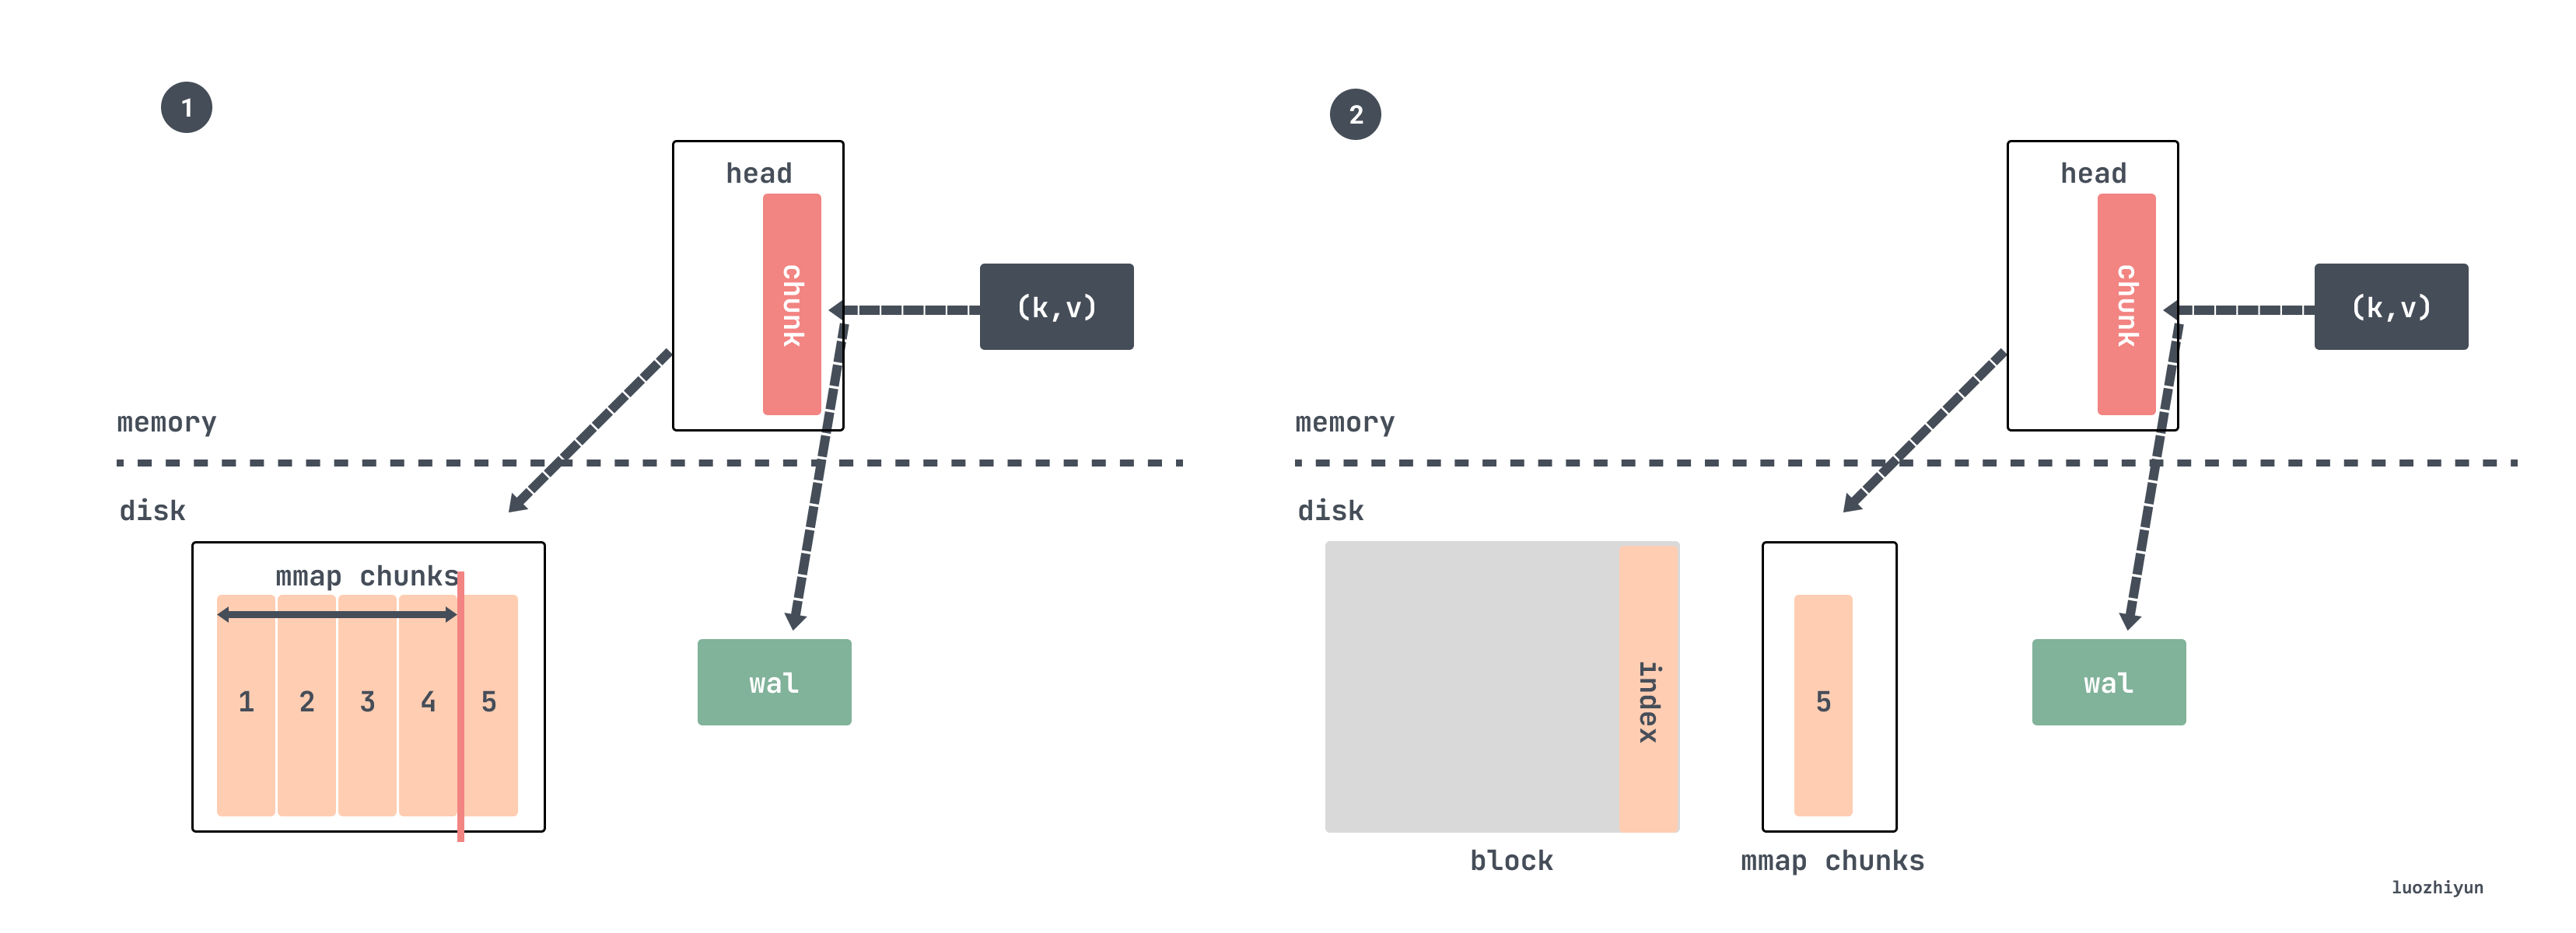
现在假设数据持续写入,过了一段时间之后会将 mmap 映射的 chunk 进行压缩并作为一个 block 进行持久化。
tsdb 在初始化的时候会后台运行一个 goroutine,每分钟检查一下 chuan的 chunkRange 跨度是否大于 chunkRange*3/2:
//tsdb/db.go
func (db *DB) run() {
    for {
        select {
        case <-time.After(1 * time.Minute):
            select {
            case db.compactc <- struct{}{}:
            default:
            }
        case <-db.compactc:
            // 校验是否进行压缩
            err := db.Compact()
            ...
        case <-db.stopc:
            return
        }
    }
}
Compact 方法里面会根据调用 compactable 方法进行校验:
func (h *Head) compactable() bool {
    return h.MaxTime()-h.MinTime() > h.chunkRange.Load()/2*3
}
chunkRange 默认值是 DefaultBlockDuration 为 2 小时:
DefaultBlockDuration = int64(2 * time.Hour / time.Millisecond)也就是校验当前写入的数据的时间跨度是否超过 3 小时,超过的话就会进行数据压缩。我们假设设置的是每 15s 抓取一次,一个 chunk 写满是 120 个 sample,也就是 30 分钟,所以每写满 3 小时 6 个 chunk 就会进行一次压缩并生成 block。
然后压缩的时候挑选最近 2 小时的指标数据进行压缩,具体代码也比较讨巧,它是通过获取 head 里面最小的数据时间然后向上 2 小时取整获取一个时间返回:
//tsdb/db.go
// 最小数据时间
mint := db.head.MinTime()
// 最大数据时间
maxt := rangeForTimestamp(mint, db.head.chunkRange.Load())

func rangeForTimestamp(t, width int64) (maxt int64) {
    // width 为2小时
    return (t/width)*width + width
}
所以对于我们上面这个例子写满一个 chunk 需要 30 分钟,所以压缩两小时数据,恰好是 4 个 chunk 了。
根据这篇 New in Prometheus v2.19.0: Memory-mapping of full chunks of the head block reduces memory usage by as much as 40% 文章的 benchmark 结果来看,将 head block 中一部分数据剔除出去只保留 120 samples 大约节省了 40% 左右的内存占用,并且这部分的内存在重启之后不再需要从 WAL log 中进行重置从而也带来了更快的启动速度。
wal
wal 是一个日志序列用来记录数据库发生的一些操作,每次在写入、修改、删除之前就会先记录一条在 wal 日志里。主要作用就是在程序挂了之后还能用这份日志数据来做恢复用,因为我们前面也说了,head 里面的chunk 并没有持久化。
wal 按序列号依次递增存储在 wal 文件夹里面,每个文件被称为 segment 默认 128MB 大小。Prometheus称这样的文件为 Segment,其中存放的就是对内存中 series 以及 sample 数据的备份。
另外还包含一个以 checkpoint 为前缀的子目录,由于内存中的时序数据经常会做持久化处理,wal 中的数据也将因此出现冗余。所以每次在对内存数据进行持久化之后也需要对 Segment 做清理。但是被删除的 Segment 中部分的数据依然可能是有用的,所以在清理时我们会将肯定无效的数据删除,剩下的数据就存放在 checkpoint 中。而在 Prometheus 重启时,应该首先加载 checkpoint 中的内容,再按序加载各个 Segment 的内容。
在磁盘上文件的目录结构看起来如下所示:
data
└── wal
    ├── checkpoint.000003
    |   ├── 000000
    |   └── 000001
    ├── 000004
    └── 000005
在清理的时候会选取 2/3 的 segment 来删除:
//tsdb/head.go
// 获取磁盘的 wal Segments 时间跨度范围
first, last, err := wlog.Segments(h.wal.Dir())
// 重新调整被删除的结束时间,只删除2/3 的数据
last = first + (last-first)*2/3
所以比方说现在有 5 个 segment:
data
└── wal
    ├── 000000
    ├── 000001
    ├── 000002
    ├── 000003
    ├── 000004
    └── 000005
那么 000000 000001 000002 000003 这几个文件将要被删除。但是这些记录不能直接删了,比如 series 记录只会写一次,那么需要把它找出来,还有一些 samples 目前不需要被删除,也需要找出来,然后创建 checkpoint 文件并写入。
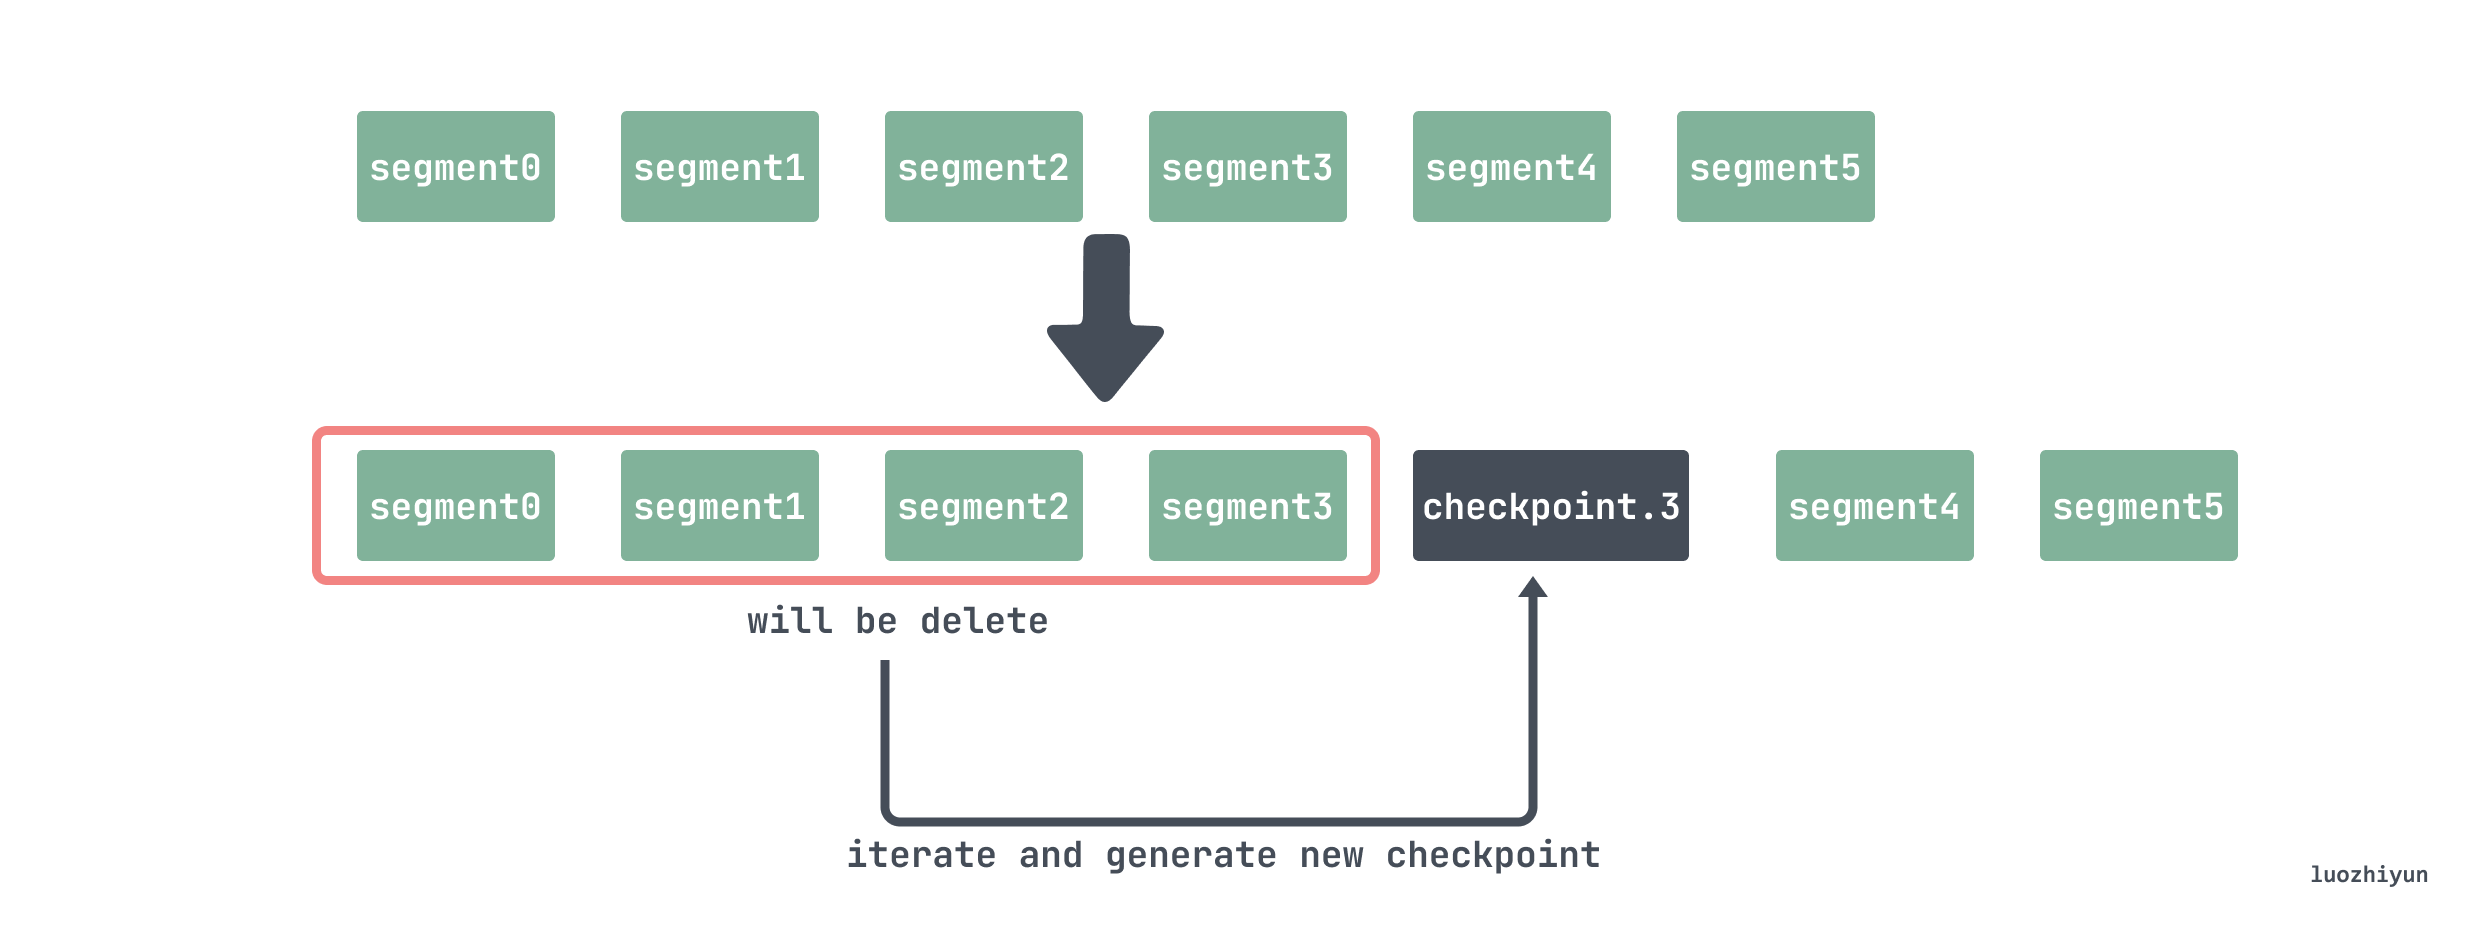
所以在删除的时候需要将 000000 000001 000002 000003 这几个文件遍历一遍,将 head 里面不再使用的 series 删除;因为在删除 segment 的时候会传入一个时间 T,表示在这个时间点之前的数据都已经持久化成 block 了,所以 wal 不需要保存,所以需要将 samples 记录在时间 T 之前的数据删除;
// tsdb/wlog/checkpoint.go
func Checkpoint(logger log.Logger, w *WL, from, to int, keep func(id chunks.HeadSeriesRef) bool, mint int64) (*CheckpointStats, error) {
    ...
    var (
        buf              []byte
        recs             [][]byte
    )
    // segment reader
    r := NewReader(sgmReader)
    ...
    for r.Next() {
        // buf 起始位置
        start := len(buf)
        //读出数据
        rec := r.Record()

        switch dec.Type(rec) {
        case record.Series:
            series, err = dec.Series(rec, series)
            // Drop irrelevant series in place.
            repl := series[:0]
            for _, s := range series {
                // 校验该 series 是否还存在在 head 中
                if keep(s.Ref) {
                    //保留
                    repl = append(repl, s)
                }
            }
            if len(repl) > 0 { // 将要保留的数据写入到 buffer 中
                buf = enc.Series(repl, buf)
            }
            stats.TotalSeries += len(series)
            stats.DroppedSeries += len(series) - len(repl)
            ...
        case record.Samples:
            samples, err = dec.Samples(rec, samples)
            repl := samples[:0]
            for _, s := range samples {
                // 校验该sample的时间是否在mint之后
                if s.T >= mint {
                    //之后的数据需要保留
                    repl = append(repl, s)
                }
            }
            if len(repl) > 0 {// 将要保留的数据写入到 buffer 中
                buf = enc.Samples(repl, buf)
            }
            stats.TotalSamples += len(samples)
            stats.DroppedSamples += len(samples) - len(repl)
            ...
         // 将buf数据写入到recs中
        recs = append(recs, buf[start:])
         // 如果buf 中的数据已经超过 1M,需要将数据写入到 checkpoint中
        if len(buf) > 1*1024*1024 {
            if err := cp.Log(recs...); err != nil {
                return nil, errors.Wrap(err, "flush records")
            }
            buf, recs = buf[:0], recs[:0]
        }
    }
    // 遍历完之后将残余数据checkpoint中
    if err := cp.Log(recs...); err != nil {
        return nil, errors.Wrap(err, "flush records")
    }
}
block
每个 block 实际上就是一个小型数据库,内部存储着该时间窗口内的所有时序数据,因此它需要拥有自己的 index 和 chunks。除了最新的、正在接收新鲜数据的 block 之外,其它 blocks 都是不可变的。
一个时间段内(默认 2 小时)的所有数据,只读,用 ULID 命名。每一个 block 内主要包括:
./data
├── 01BKGTZQ1SYQJTR4PB43C8PD98
│   ├── chunks
│   │   └── 000001
│   ├── tombstones
│   ├── index
│ └── meta.json- meta.json 元信息,主要包括 block 的 minTime/maxTime,方便查询时过滤;
- chunks 是一个子目录,包含了若干个从 000001 开始编号的文件,一般每个文件大小的上限为512M。文件中存储的就是在时间窗口[minTime,maxTime]以内的所有 samples;
- tombstones 用于存储对于 series 的删除记录。如果删除了某个时间序列,Prometheus并不会立即对它进行清理,而是会在 tombstones 做一次记录,等到下一次Block压缩合并的时候统一清理;
- index 索引文件,主要包含倒排索引的信息;
index 数据查找
我们现在看看 index 整体的数据结构:
┌────────────────────────────┬─────────────────────┐
│ magic(0xBAAAD700) <4b>     │ version(1) <1 byte> │
├────────────────────────────┴─────────────────────┤
│ ┌──────────────────────────────────────────────┐ │
│ │                 Symbol Table                 │ │
│ ├──────────────────────────────────────────────┤ │
│ │                    Series                    │ │
│ ├──────────────────────────────────────────────┤ │
│ │                 Label Index 1                │ │
│ ├──────────────────────────────────────────────┤ │
│ │                      ...                     │ │
│ ├──────────────────────────────────────────────┤ │
│ │                 Label Index N                │ │
│ ├──────────────────────────────────────────────┤ │
│ │                   Postings 1                 │ │
│ ├──────────────────────────────────────────────┤ │
│ │                      ...                     │ │
│ ├──────────────────────────────────────────────┤ │
│ │                   Postings N                 │ │
│ ├──────────────────────────────────────────────┤ │
│ │               Label Index Table              │ │
│ ├──────────────────────────────────────────────┤ │
│ │                 Postings Table               │ │
│ ├──────────────────────────────────────────────┤ │
│ │                      TOC                     │ │
│ └──────────────────────────────────────────────┘ │
└──────────────────────────────────────────────────┘
我们这里介绍一些和数据查询有关的结构,其余的详细信息可以去这里看: index。
首先是 TOC(Table Of Content),它存储的内容是其余六部分的位置信息,即它们的起始位置在 index 文件中的偏移量。结构如下:
┌─────────────────────────────────────────┐
│ ref(symbols) <8b>                       │
├─────────────────────────────────────────┤
│ ref(series) <8b>                        │
├─────────────────────────────────────────┤
│ ref(label indices start) <8b>           │
├─────────────────────────────────────────┤
│ ref(label offset table) <8b>            │
├─────────────────────────────────────────┤
│ ref(postings start) <8b>                │
├─────────────────────────────────────────┤
│ ref(postings offset table) <8b>         │
├─────────────────────────────────────────┤
│ CRC32 <4b>                              │
└─────────────────────────────────────────┘
如果我们要找某个指标在 chunk 中的位置,那么首先可以通过上面这些偏移去查找倒排索引。因为 prometheus 存放的 key/value 数据很多,所以为了实现快速查找在 index 里面构建了倒排索引,并将数据存放在 Posting offset table 以及 Posting 中。
倒排索引方式组织如下:
- 首先给每个 series 分配1个 id,用 seriesId 查询 series ,这是前向索引,查询时间复杂度=O(1);
- 构造 label 的索引,若
seriesId={2,5,10,29}都含有label: app='nginx',那么,对于app='nginx",{2,5,10,29}就是它的倒排索引;
通过这种方式可以快速的找到对应的 seriesId 。
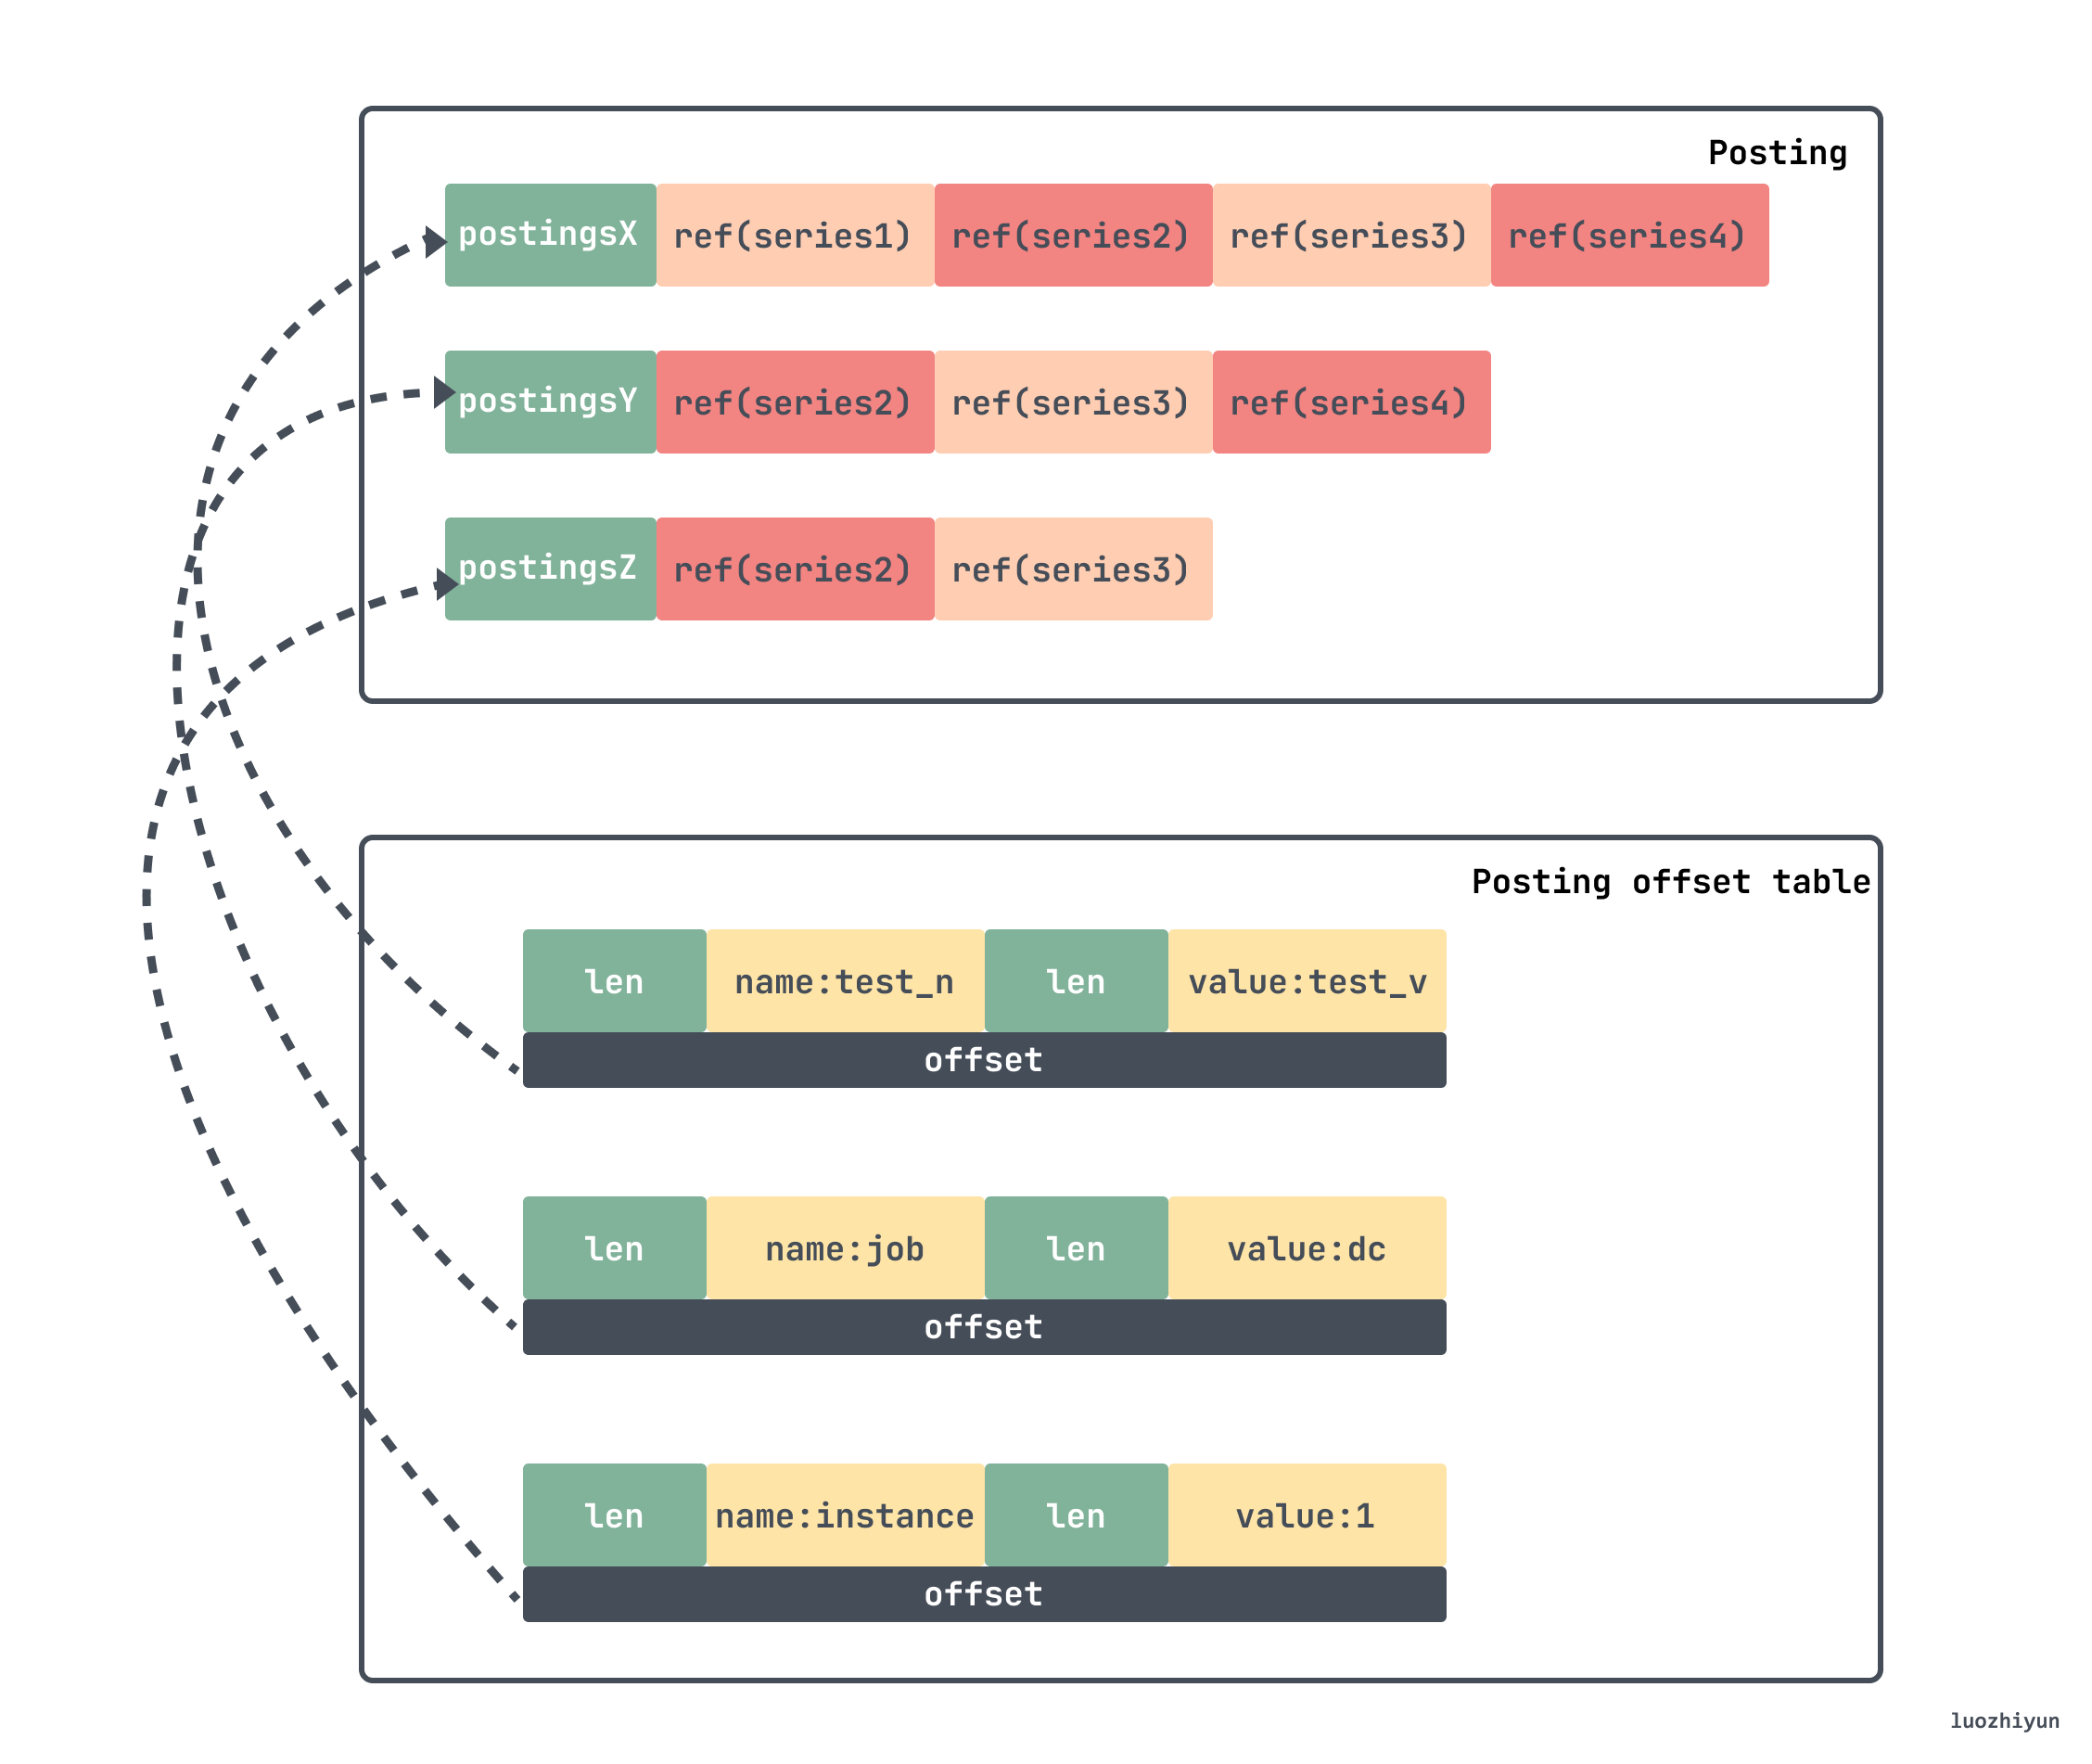
假如我们要找上面 lable 对应的 series ,那么就需要先到 Posting offset table 找到对应的 offset,这个 offset 是 Posting 的偏移,去到里面找到对应的条目,之后取与,得出对应的 seriesId 。那么在我们上面的例子中最后得到的 seriesId 列表就是 {Series2,Series3}。
找到对应的 seriesId 之后就去 index 的 series 段中去找对应的 chunk 信息。series 段中首先存储 series 的各个 label 的 key/value 信息。紧接着存储 series 相关的 chunks 信息,包含每个 chunk 的时间窗口,以及该chunk 在 chunks 子目录下具体的位置信息,然后再按照chunk文件的访问,即可找到最终的原始数据。
┌──────────────────────────────────────────────────────────────────────────┐
│ len <uvarint>                                                            │
├──────────────────────────────────────────────────────────────────────────┤
│ ┌──────────────────────────────────────────────────────────────────────┐ │
│ │                     labels count <uvarint64>  //lable数量             │ │
│ ├──────────────────────────────────────────────────────────────────────┤ │
│ │ lable列表     ┌────────────────────────────────────────────┐          │ │
│ │              │ ref(l_i.name) <uvarint32>   //label名      │          │ │
│ │              ├────────────────────────────────────────────┤          │ │
│ │              │ ref(l_i.value) <uvarint32>  //label值      │          │ │
│ │              └────────────────────────────────────────────┘          │ │
│ │                             ...                                      │ │
│ ├──────────────────────────────────────────────────────────────────────┤ │
│ │                     chunks count <uvarint64>  //chunk数量             │ │
│ ├──────────────────────────────────────────────────────────────────────┤ │
│ │ chunk列表     ┌────────────────────────────────────────────┐          │ │
│ │              │ c_0.mint <varint64>                        │          │ │
│ │              ├────────────────────────────────────────────┤          │ │
│ │              │ c_0.maxt - c_0.mint <uvarint64>            │          │ │
│ │              ├────────────────────────────────────────────┤          │ │
│ │              │ ref(c_0.data) <uvarint64>                  │          │ │
│ │              └────────────────────────────────────────────┘          │ │
│ │              ┌────────────────────────────────────────────┐          │ │
│ │              │ c_i.mint - c_i-1.maxt <uvarint64>          │          │ │
│ │              ├────────────────────────────────────────────┤          │ │
│ │              │ c_i.maxt - c_i.mint <uvarint64>            │          │ │
│ │              ├────────────────────────────────────────────┤          │ │
│ │              │ ref(c_i.data) - ref(c_i-1.data) <varint64> │          │ │
│ │              └────────────────────────────────────────────┘          │ │
│ │                             ...                                      │ │
│ └──────────────────────────────────────────────────────────────────────┘ │
├──────────────────────────────────────────────────────────────────────────┤
│ CRC32 <4b>                                                               │
└──────────────────────────────────────────────────────────────────────────┘
总结
其实通篇看下来我们可以很清晰的了解到 Prometheus 数据写入思路其实是很清晰的。因为 tsdb 数据有其特点,它是基于相对稳定频率持续产生的一系列指标监测数据,那么存储就是一些标签键加上一个时间序列作为一个大 key,值就是一个数字,这些数据就构成了一个时间序列数据,因此键值数据库天然地可以作为时序数据的载体。
然后对于数据的存储 Prometheus 按冷热数据进行分离,最近的数据肯定是看的最多的,所以缓存在内存里面,为了防止宕机而导致数据丢失因而引入 wal 来做故障恢复。数据超过一定量之后会从内存里面剥离出来以 chunk 的形式存放在磁盘上这就是 head chunk。对于更早的数据会进行压缩持久化变成 block 存放到磁盘中。
对于 block 中的数据由于是不会变的,数据较为固定,所以每个 block 通过 index 来索引其中的数据,并且为了加快数据的查询引用倒排索引,便于快速定位到对应的 chunk。
Reference
https://tech.ipalfish.com/blog/2020/03/31/the-evolution-of-prometheus-storage-layer/
https://github.com/prometheus/prometheus/blob/main/tsdb/docs/format/index.md
https://liujiacai.net/blog/2021/04/11/prometheus-storage-engine/
Be smarter in how we look at matchers https://github.com/prometheus-junkyard/tsdb/pull/572
Prometheus TSDB (Part 1): The Head Block https://ganeshvernekar.com/blog/prometheus-tsdb-the-head-block/
https://prometheus.kpingfan.com/
Index Disk Format https://github.com/prometheus/prometheus/blob/main/tsdb/docs/format/index.md
https://yunlzheng.gitbook.io/prometheus-book/
TSDB format https://github.com/prometheus/prometheus/blob/release-2.40/tsdb/docs/format/README.md
https://prometheus.io/docs/prometheus/latest/storage/
https://grafana.com/blog/2022/09/07/new-in-grafana-mimir-introducing-out-of-order-sample-ingestion/
https://github.com/prometheus/prometheus/blob/release-2.40/tsdb/docs/refs.md
Persistent Block and its Index https://ganeshvernekar.com/blog/prometheus-tsdb-persistent-block-and-its-index
head block https://segmentfault.com/a/1190000041199554
New in Grafana Mimir: Introducing out-of-order sample ingestion https://grafana.com/blog/2022/09/07/new-in-grafana-mimir-introducing-out-of-order-sample-ingestion/?mdm=social
https://segmentfault.com/a/1190000041117609
https://heapdump.cn/article/2282672